.png)
.png)
.png)
GAT System
At first glance
The challenge
- Our client relied on an outdated Android app that was taken offline by a previous provider, forcing teams back to paper forms and spreadsheets.
- Field agents lacked reliable tools, and route planners had limited access to trustworthy, structured data to support nationwide decision-making.
The solution
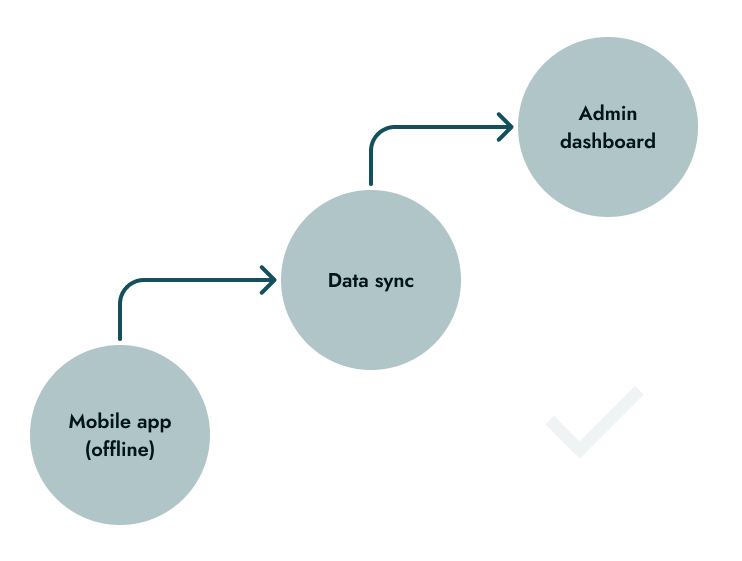
GAT is a custom web and Android solution that enables large-scale urban mobility surveys. Field agents collect data offline in real-world conditions, while planners and supervisors access structured, reliable information through an admin dashboard.
Nationwide deployment

Offline-first mobile app

Hundreds of survey inputs per day

Data ownership & scalability
Context
Urban transportation decisions are only as good as the data behind them.
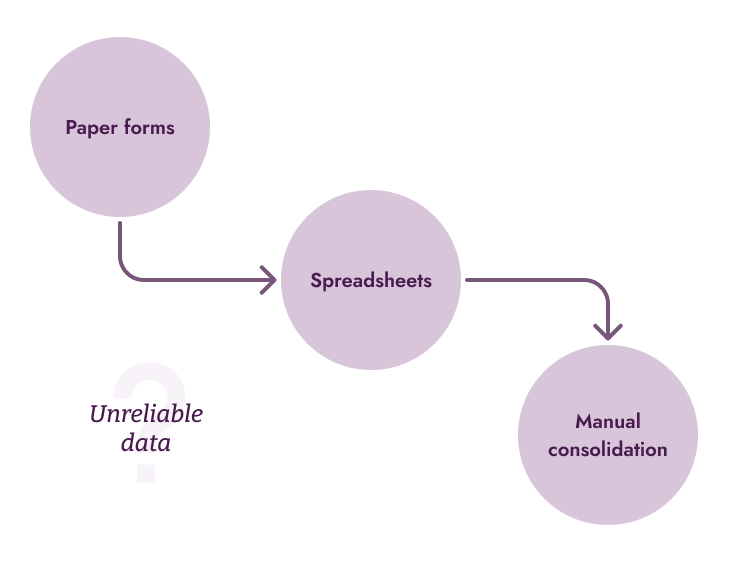
Our client plans public transportation routes using field research such as surveys, traffic counts, and on-site studies. When their third-party Android app was taken offline, they lost access to both the tool and the data, forcing teams back to paper forms and spreadsheets. This made supervision difficult and compromised data reliability at scale.
No data ownership
after third party shutdown
Manual processes
(paper and spreadsheet)
Offline field work
in real urban conditions
Nationwide scalability
with non-technical users
Before
After
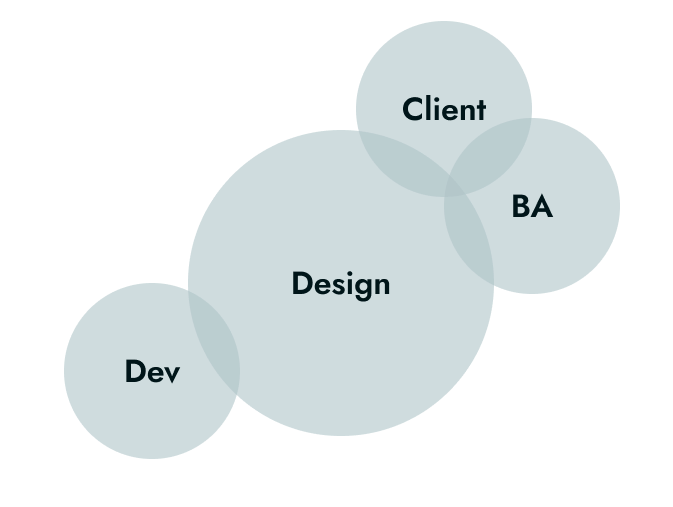
My Role
I worked as a solo Product Designer, collaborating closely with developers and a business analyst throughout the discovery and design phases.
What I owned
- UX flows for the admin dashboard and mobile app
- UI design across web and Android
- Design system foundations for consistency and scalability
- Early usability testing through interactive prototypes
What I didn't own
- Core information architecture definition
- Development and implementation
- Late-stage testing with real end users
Approach and Strategy
Two core principles shaped the product from end to end.

Reduce cognitive load for field agents
Design for fast, error-free data capture in noisy, real-world environments. Clear guidance, immediate feedback, and minimal steps keep agents focused on the task, not the interface.
.png)
Make data readable and trustworthy for planners
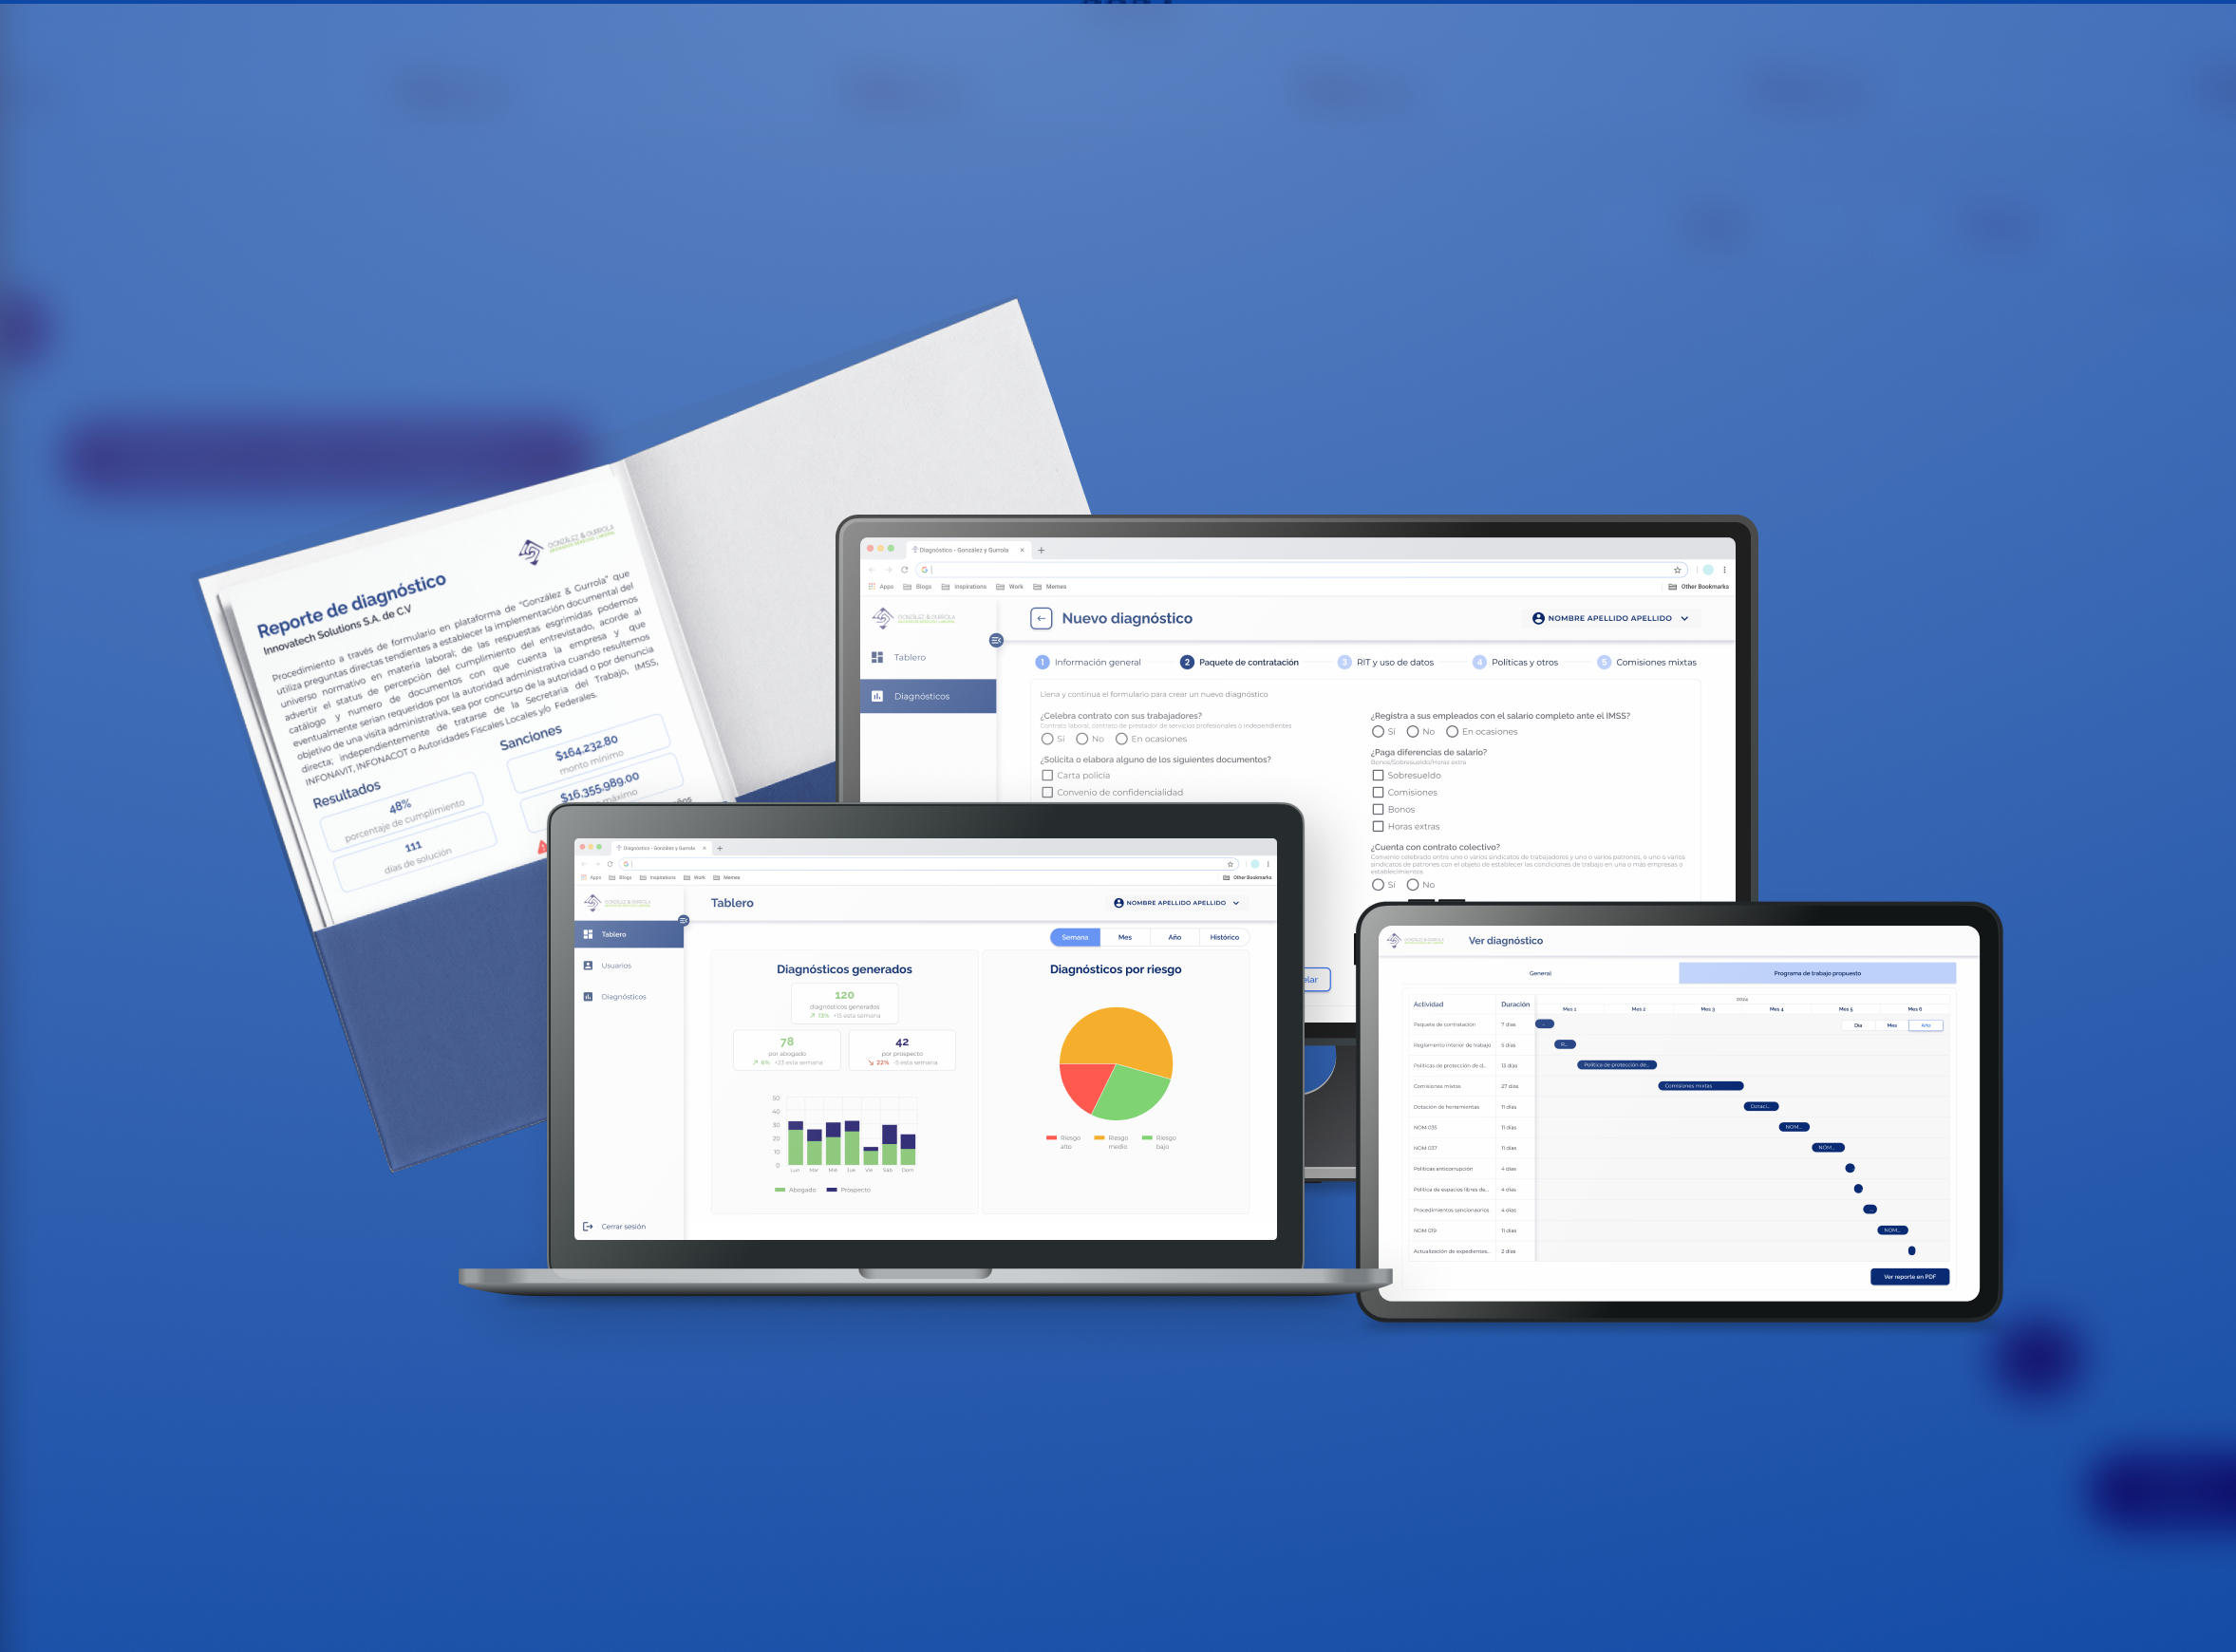
Ensure supervisors and planners can configure surveys and interpret results with confidence through clear data structures, legible visualization, and reliable system behavior.
To balance complexity, the admin system favored configurability over simplicity, relying on familiar UI patterns, contextual tooltips, and a live preview to reduce uncertainty while creating surveys.Two core principles shaped the product from end to end.
Key decisions and iterations
Key product decisions were informed by real usage contexts, early validation, and continuous iteration to balance usability, speed, and scalability.We iterated constantly and learned through trial, feedback, and failure.
Admin Web App | Nationwide overview → Drill-down
Admins start with a high-level view of projects and performance, then progressively focus on specific regions or surveys. This supports fast orientation before detailed analysis.
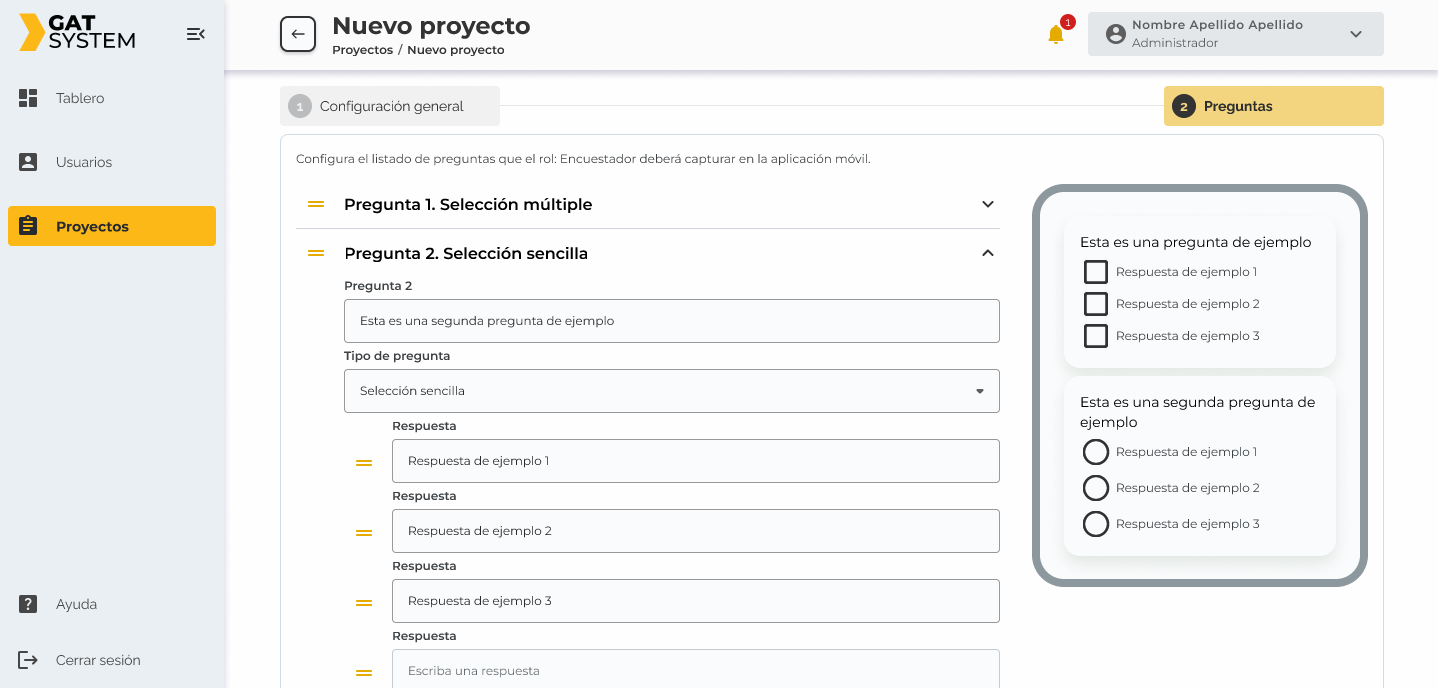
Admin Web App | Survey previsualizer
A live preview shows how surveys appear to field agents, reducing uncertainty, configuration errors, and rework before deployment.
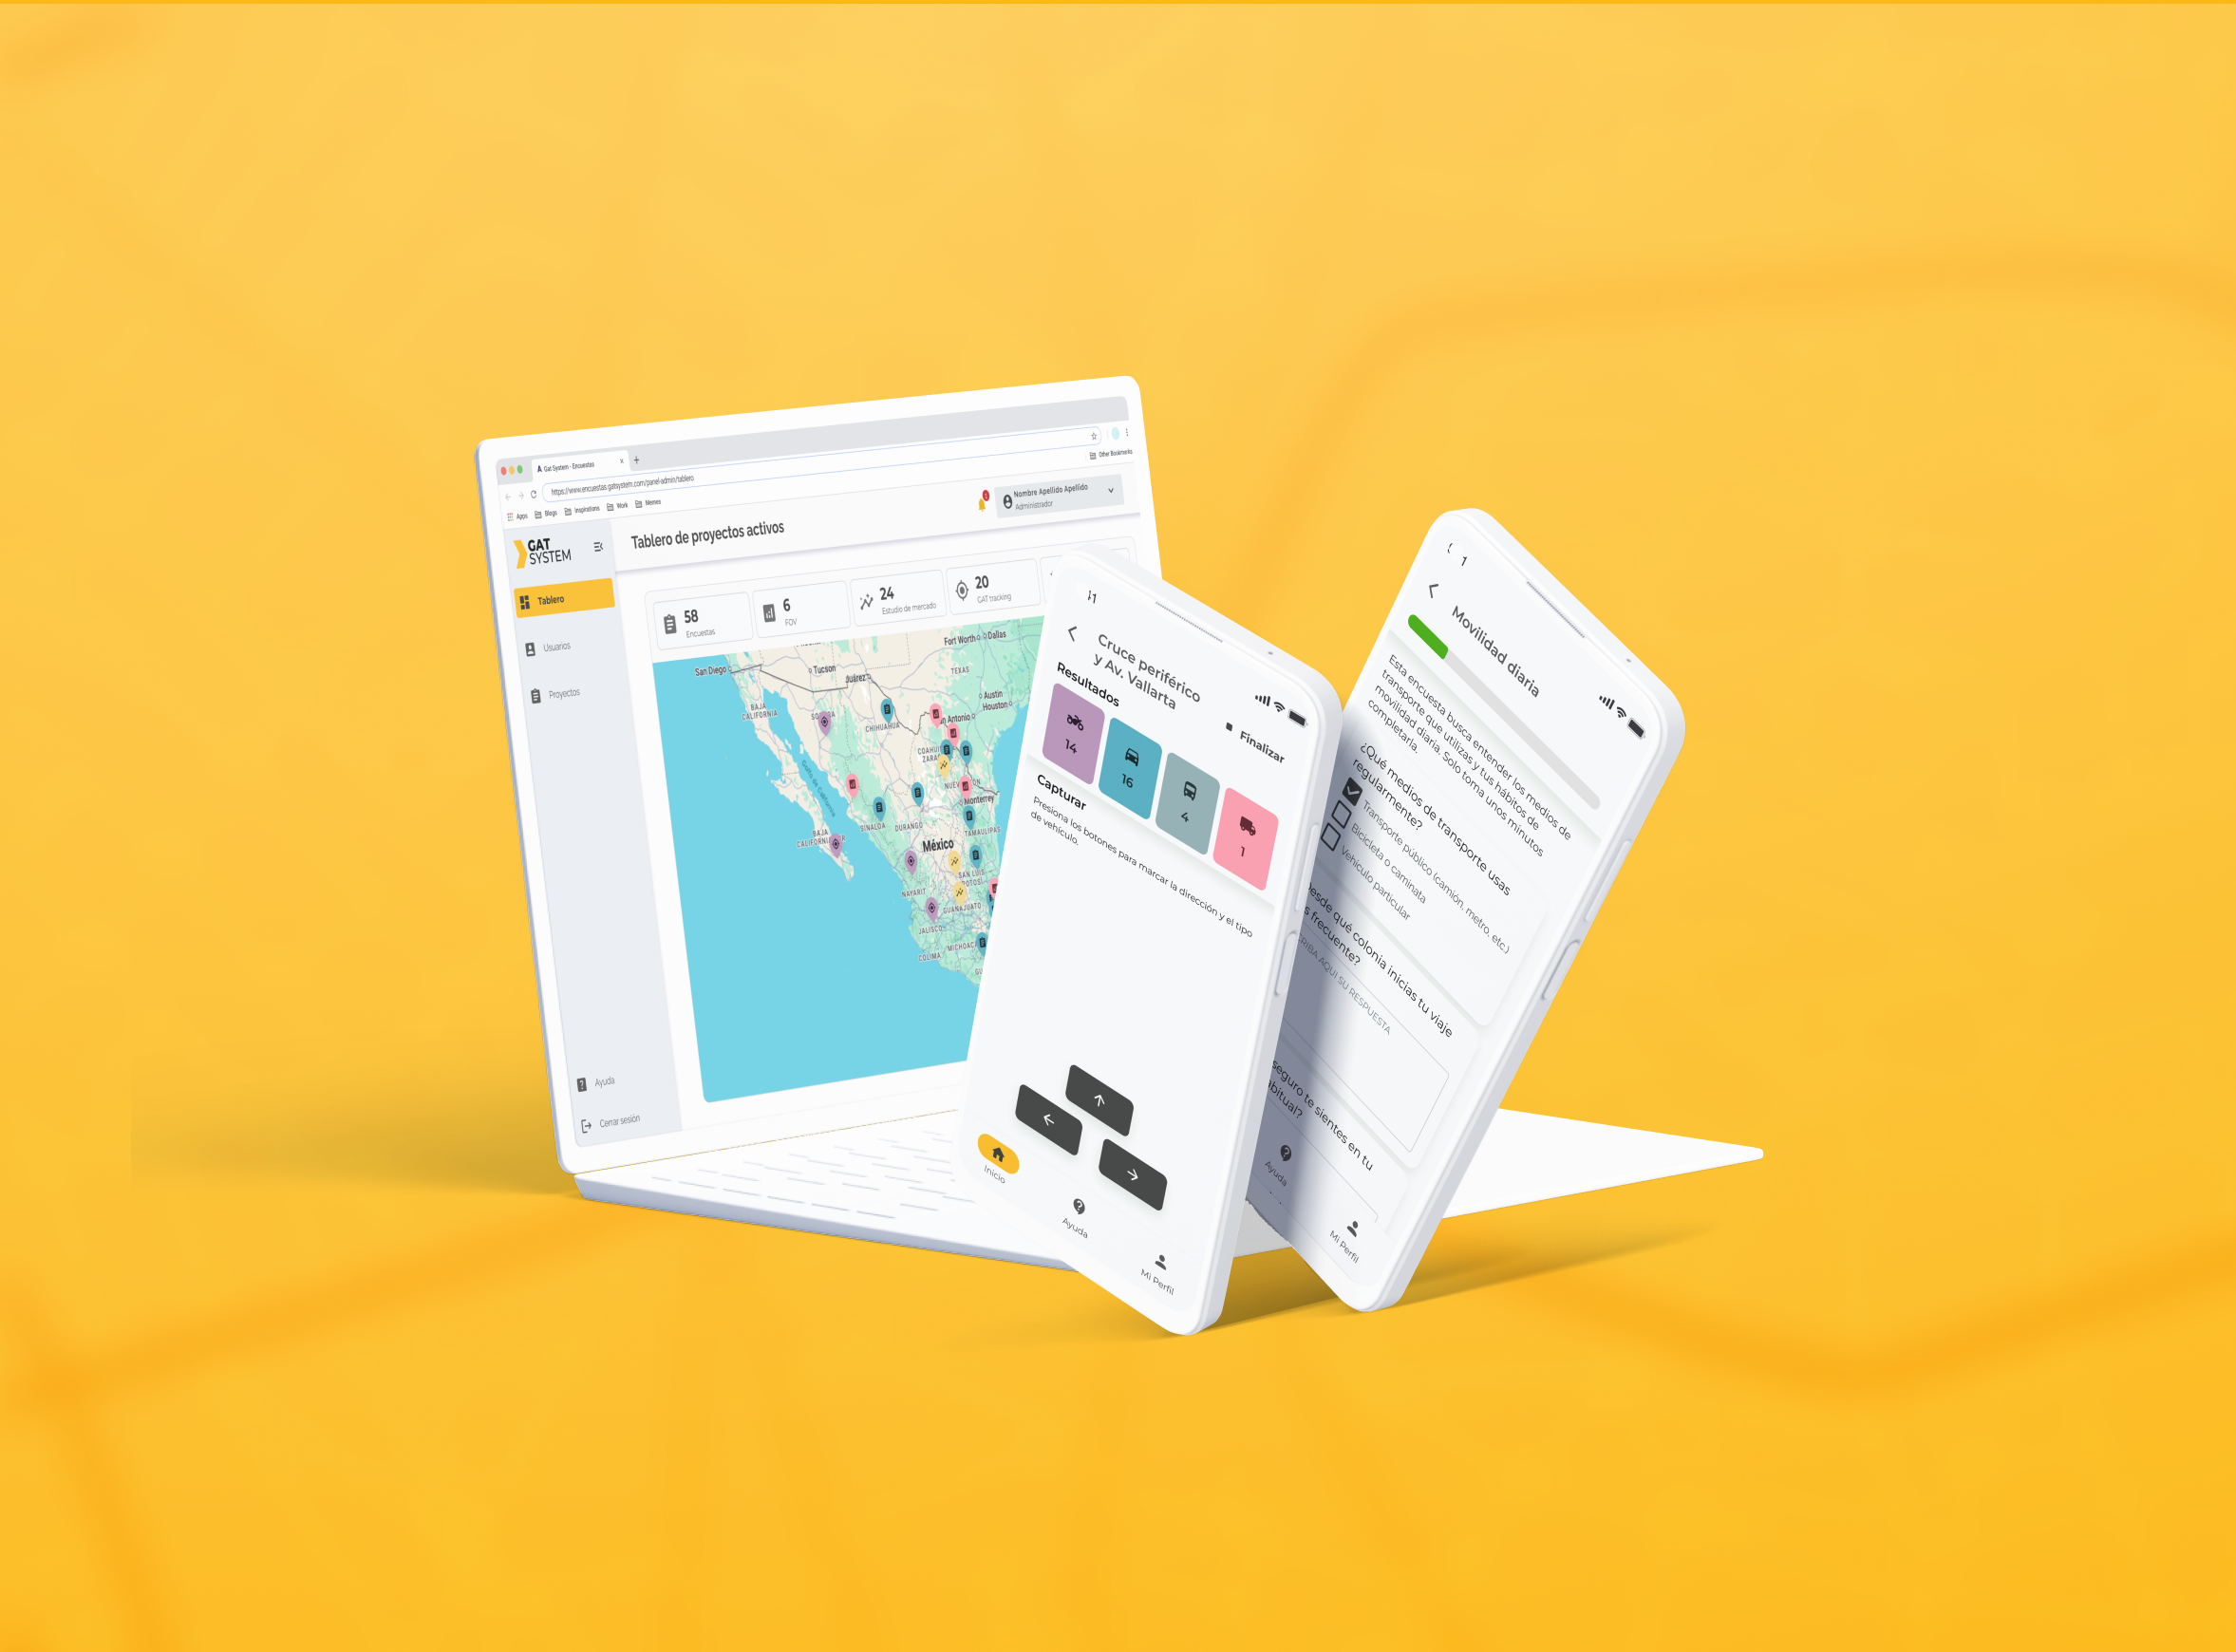
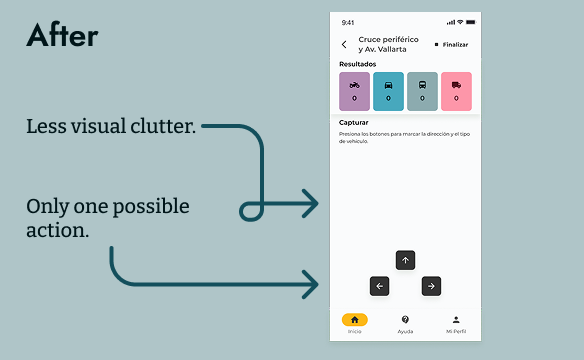
Agent Android App | Guided, step by step input for aforo projects
To avoid cognitive overload, inputs are split into clear steps instead of presenting all options at once.
Step 1:
Select direction
Step 2:Select vehicle type (overlay)
Agent Android App | Inmediate feedback without breaking flow
Each input confirms success instantly:
- Counter increments
- Card blinks once
This reassures agents that data was captured while keeping them focused on the environment, not the screen.
Rejected Direction | Vehicle + direction shown simultaneously
Early peer testing revealed hesitation and confusion. Splitting the action into two steps significantly improved speed and accuracy.

Collaboration and Alignment
I worked closely with a cross-functional team to align user needs, technical feasibility, and operational goals.
- Developers (Full-stack & Android): Iterated asynchronously through prototypes, validating feasibility early and adjusting flows to fit technical constraints without compromising usability.
- Business Analyst: Partnered to clarify information architecture goals and ensure the UX supported real operational workflows and data structures.
- Client Project Ambassador: Validated formats, field workflows, and assumptions based on real-world research practices, especially for on-site and offline use.
This continuous collaboration allowed the product to evolve quickly while staying grounded in real constraints and use cases.
Results and impact
The solution reduced operational friction and increased confidence in field data by replacing manual processes with a reliable, offline-first digital system.
.png)
Eliminated paper-based data collection and manual digitization
.png)
Improved perceived trust and reliability of collected data
.png)
Faster and more consistent data synchronization for supervisors
.png)
Reduced input errors through guided, feedback-driven flows
Lessons and Reflections
Reflections on what worked, what could improve, and how the product could evolve further.
What I’d repeat
Early and continuous collaboration with developers was critical to translating complex, real-world processes into usable and technically feasible digital flows.
What I’d do differently
I would involve real field agents earlier and more frequently. Testing relied mainly on user surrogates, which limited exposure to on-site constraints.
Next steps
- Deeper data visualization for planners and supervisors
- Analytics to detect anomalies, trends, and outliers
- Expanded usability testing in real field conditions
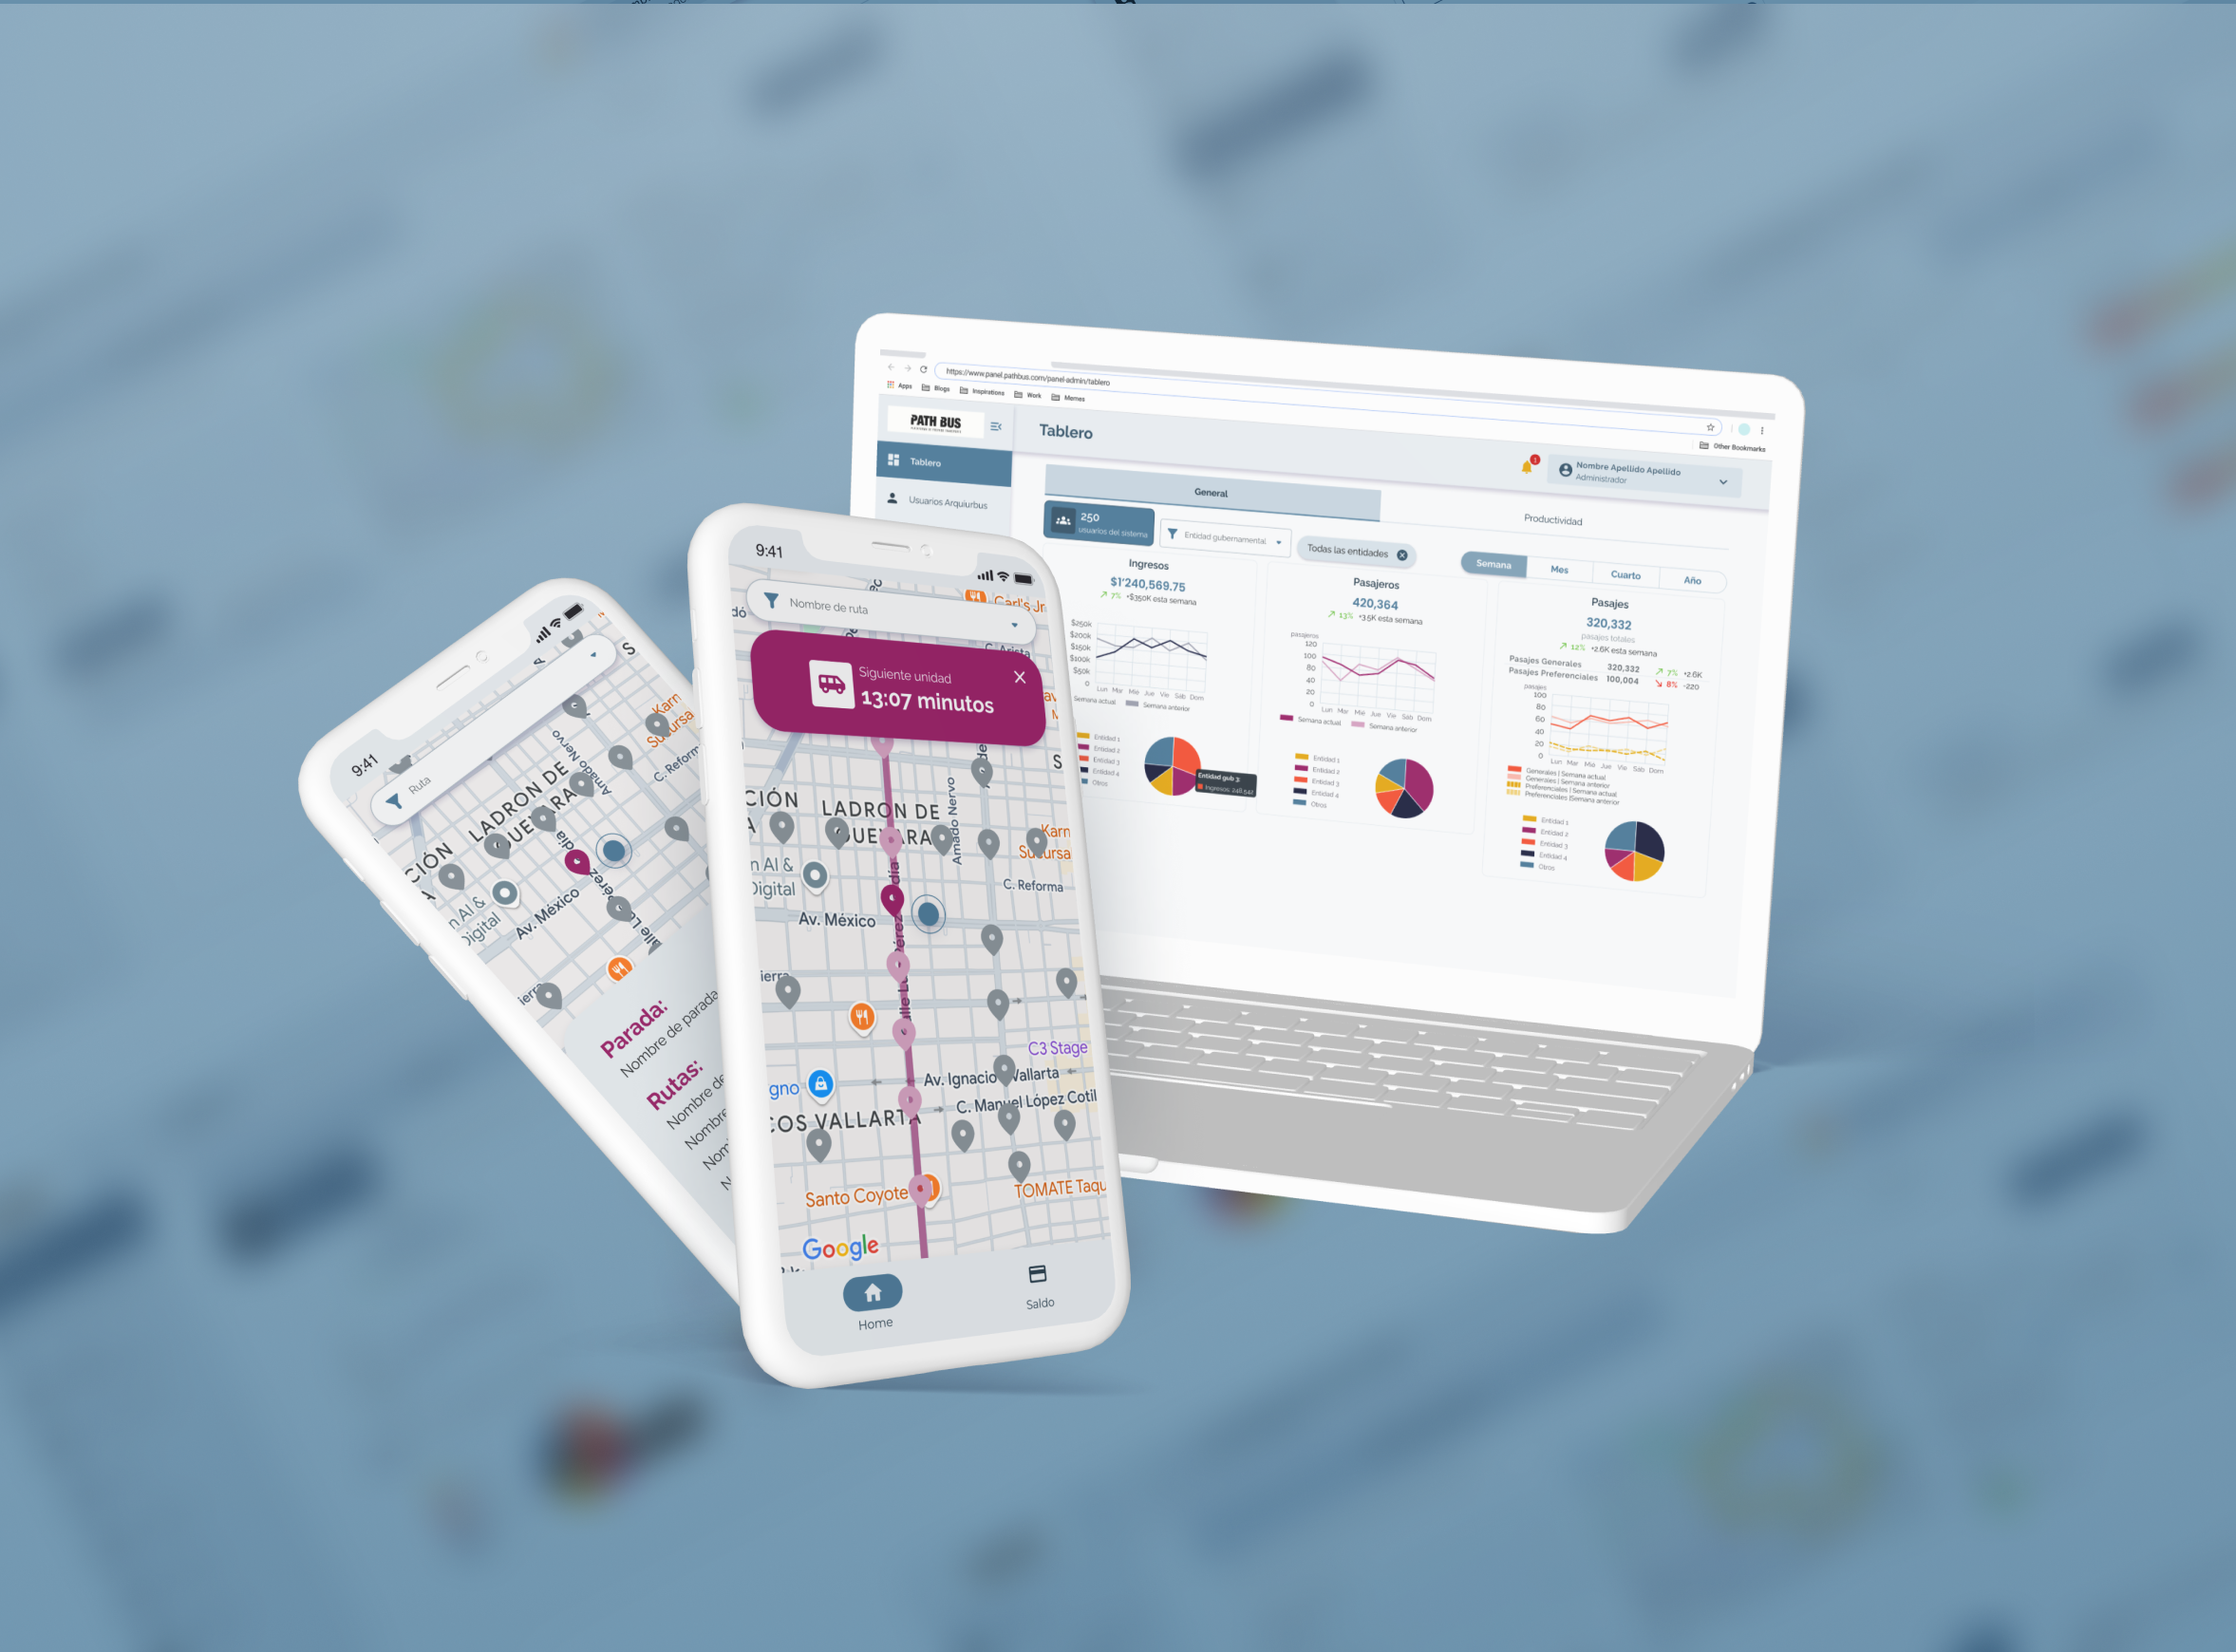
Other projects
Public Transport Management Platform
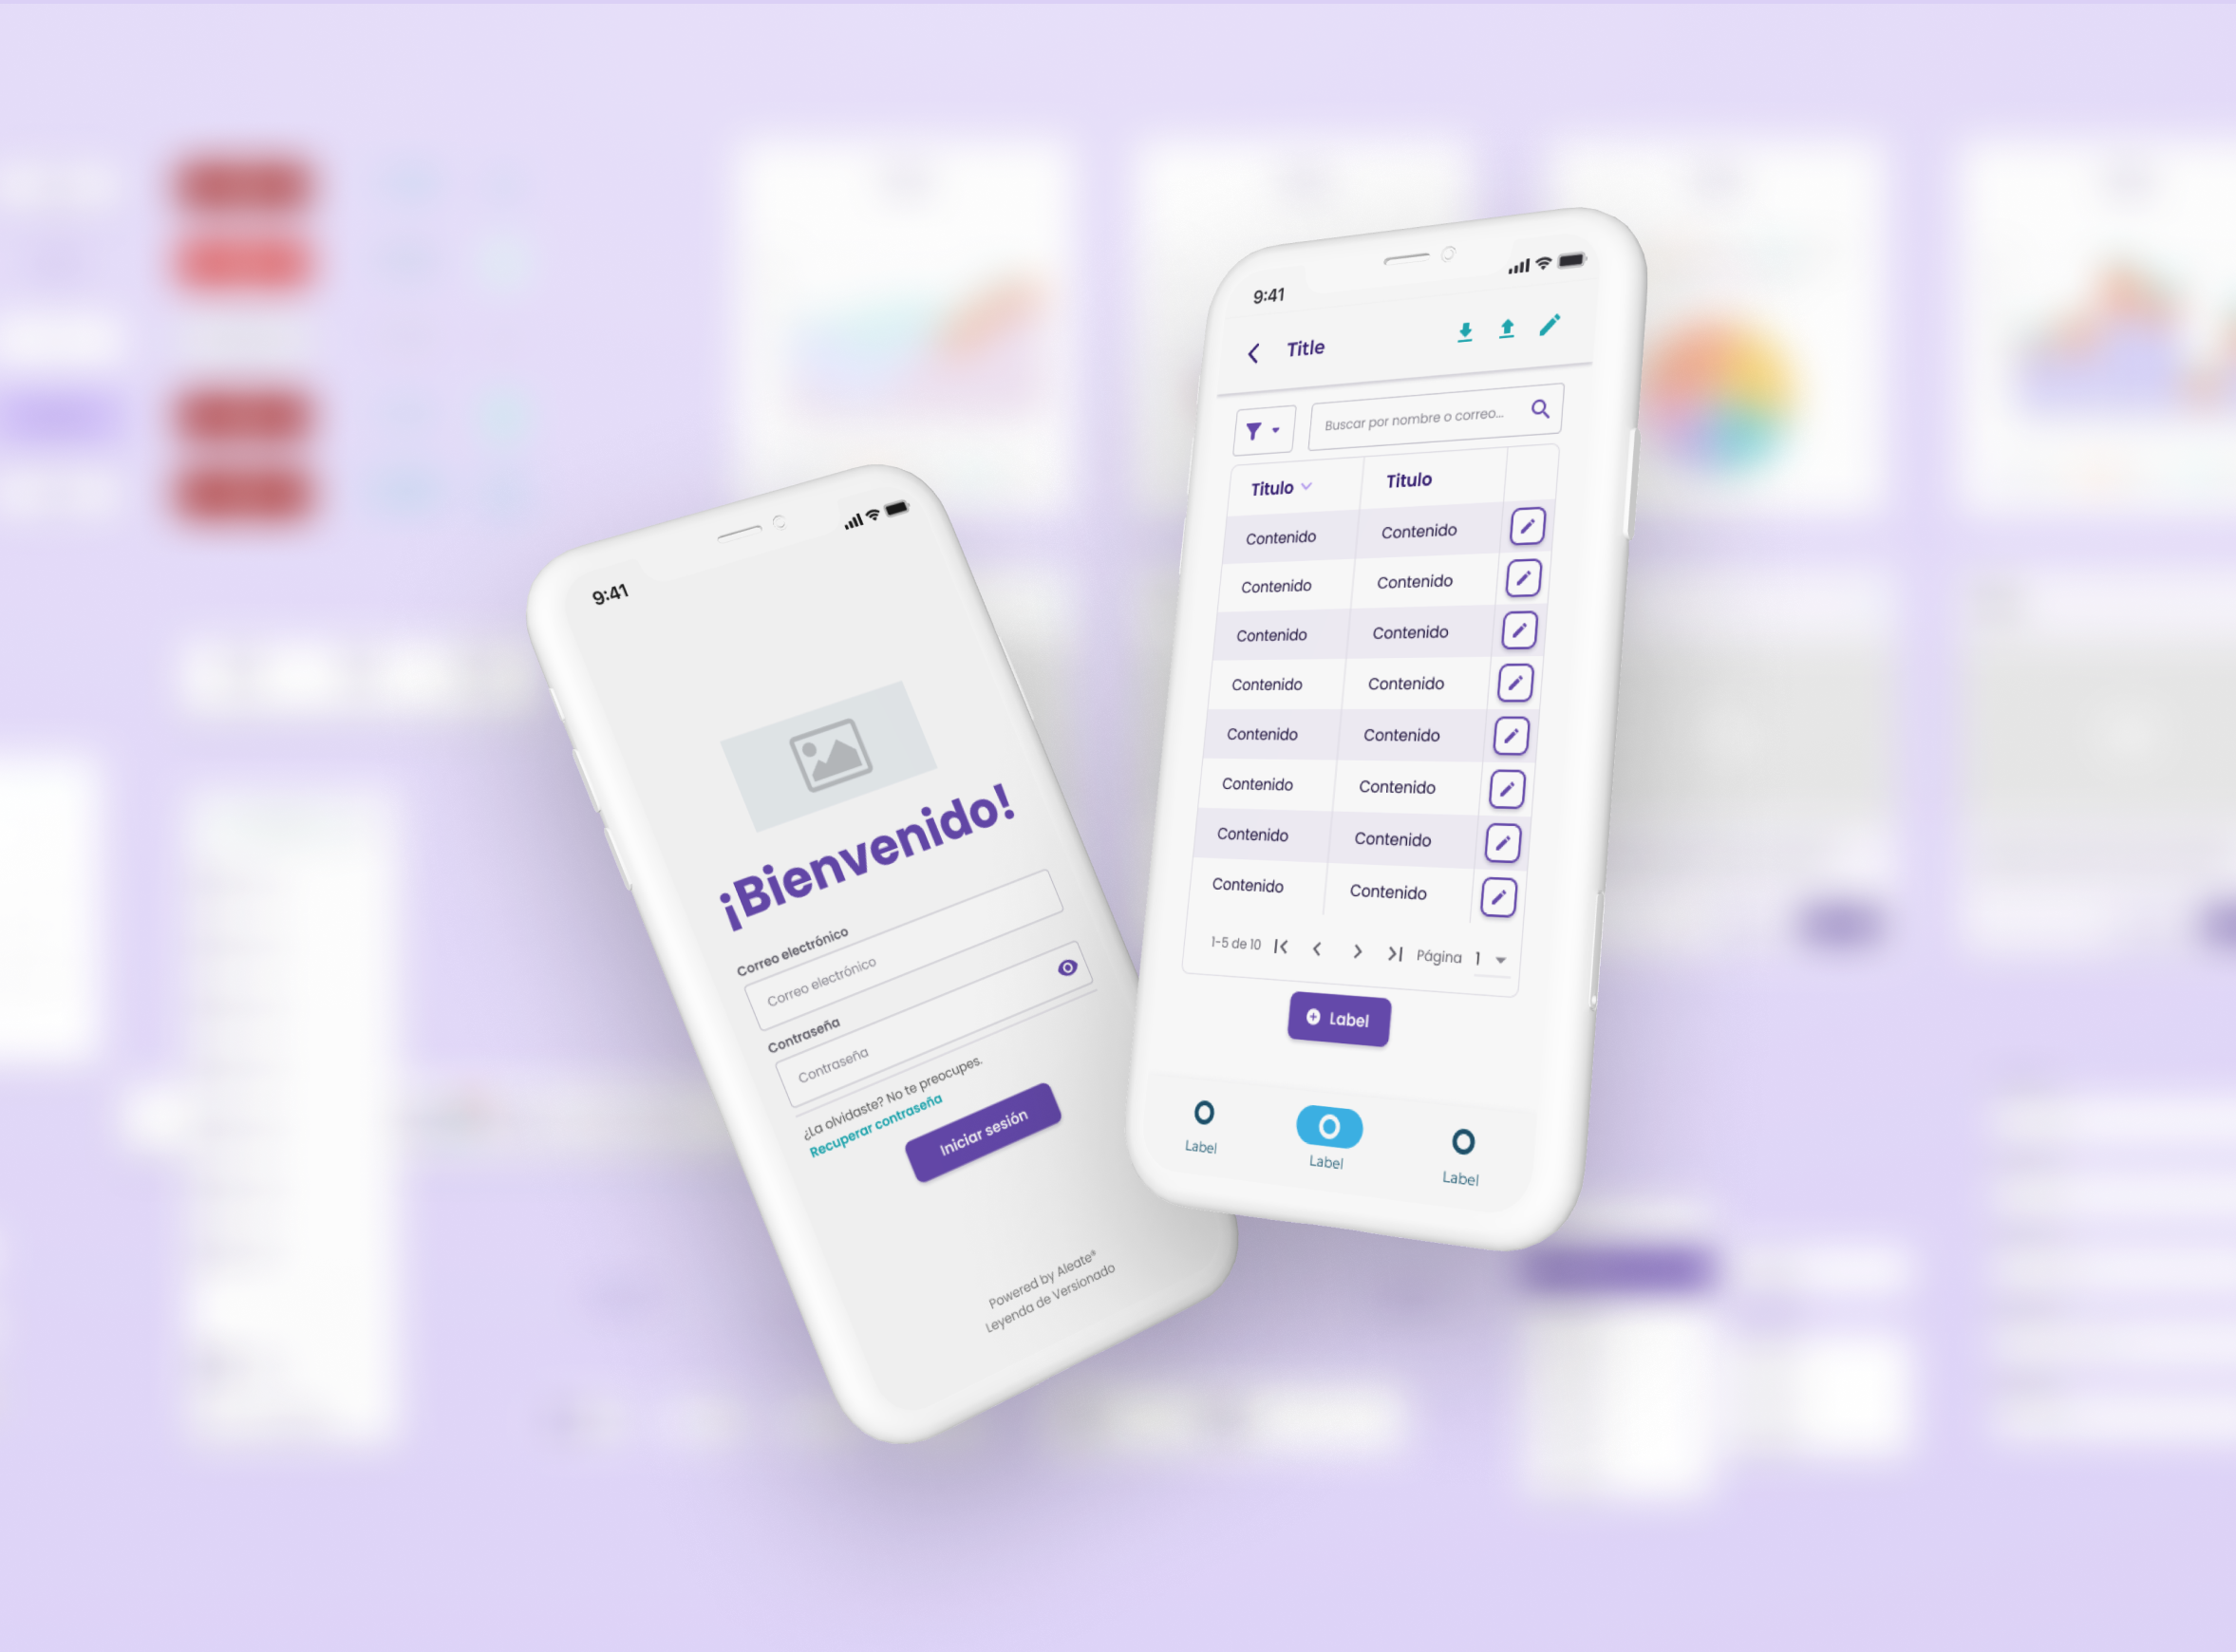
Design System | Aleate
Lead System Designer
Compliance Risk Assessment Tool
Product Designer